This page enables you to view the current state of Functional tests, test sets, and build verification suite runs.
Note: If you have Internet Explorer 10 or later, see Execution Report Page - Web Client.
| To access |
The Execution Report automatically appears when you run a Functional test or test set, or a build verification suite. There are also several ways you can view the Execution Report after or during a run:
|
| Important information |
The Execution Report provides general details about the run, overall information per test set, as well as drilled-down run information for each individual test within the run. The Execution Report is available only for Functional test and test set runs, and build verification suite runs. ALM Editions: The Execution Report page is available only in ALM Edition. For more information about ALM editions and their functionality, see ALM Editions. To find out what edition of ALM you are using, ask your ALM site administrator. |
| Relevant tasks | |
| See also |
 .
.User interface elements are described below (unlabeled elements are shown in angle brackets):
|
UI Element |
Description |
|---|---|

|
Enables you to stop all tests in the run. |

|
Opens the event log. For details, see the Micro Focus ALM Lab Management Guide |
|
|
AutoRefresh. Automatically refreshes the run data at the selected interval. |

|
Refreshes the run data. |

|
Opens the help topic for the Execution Report page. |
| <Run details section> |
Contains the details of the run. The details include the following:
|
| Environment Details |
Note: This section is visible only when an AUT environment configuration was used for the selected run. Displays the AUT Environment details and state. You can click AUT Details to see a drilldown view of the AUT Environment details and CDA topology. You can click Build information for further details about the selected build. For details about Deployment details, see How to Work with AUT Environments. |
| Execution Details | Details about the test sets or test instances included in the run. |

|
Stop Selected Run. Enables you to stop the selected run. |

|
Run Screen. For Performance test runs, opens the Performance Test Run screen, enabling you to view and manage the test run. For details, refer to the Performance Center documentation. Note: Only enabled when the test run is in the Running state. |
| <Execution Report Grid> |
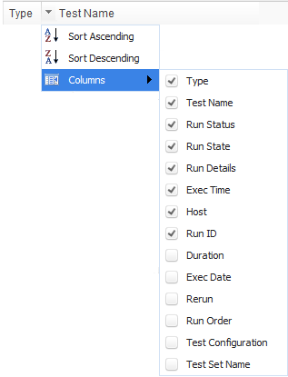
Displays a list of the tests or test sets contained in this run. For field definitions see Test Lab Module Fields. To sort a column alphabetically, click the drop-down arrow that appears when you hover over the right corner of a column heading. You can also add or remove columns from the grid by checking and unchecking them here.
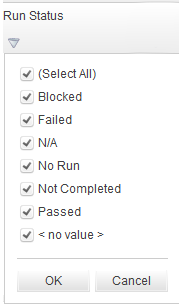
To filter a column, type a filter string into the text box, or click on the arrow below the column heading.
|
| Run Details | Displays the Run Details field in a large space. |